Asean-China Economic Data
By:CNBS, ASEANstats, WDB, WEO Database Update:2016-06-01
Asean-China Economic Data of Tade in Goods
|
Years
|
2014
|
2013
|
2012
|
2011
|
2010
|
2009
|
2008
|
2007
|
2006
|
2005
|
|
China-Philippines total import and export volume(ten-thousand dollars)
|
4445771
|
3804994
|
3637546
|
3224704
|
2776223
|
2053900
|
2863698
|
3061576
|
2341270
|
1755732
|
|
China-Cambodia total import and export volume(ten-thousand dollars)
|
375765
|
377314
|
292343
|
249911
|
144097
|
94415
|
113437
|
93399
|
73286
|
56334
|
|
China-Laos total import and export volume(ten-thousand dollars)
|
361736
|
273266
|
172078
|
130088
|
108512
|
75180
|
40237
|
26386
|
21836
|
12893
|
|
China-Malaysia total import and export volume(ten-thousand dollars)
|
10200563
|
10608338
|
9483205
|
9002270
|
7424884
|
5196769
|
5355657
|
4638632
|
3710951
|
3069956
|
|
China-Myanmar total import and export volume(ten-thousand dollars)
|
2496893
|
1019556
|
697194
|
650140
|
444207
|
290012
|
262532
|
207784
|
146007
|
120925
|
|
China-Thailand total import and export volume(ten-thousand dollars)
|
7262116
|
7124055
|
6975086
|
6473385
|
5293702
|
3819082
|
4129309
|
3463812
|
2772649
|
2181119
|
|
China-Brunei total import and export volume(ten-thousand dollars)
|
193653
|
179358
|
162554
|
131121
|
103194
|
42244
|
21943
|
35876
|
31494
|
26087
|
|
China-Singapore total import and export volume(ten-thousand dollars)
|
7973991
|
7589638
|
6927265
|
6371006
|
5707598
|
4785587
|
5247707
|
4714398
|
4085791
|
3314686
|
|
China-Indonesia total import and export volume(ten-thousand dollars)
|
6354485
|
6835475
|
6623408
|
6055462
|
4275028
|
2838876
|
3151605
|
2499641
|
1905546
|
1678733
|
|
China-Vietnam total import and export volume(ten-thousand dollars)
|
8363641
|
6547819
|
5043941
|
4020784
|
3008608
|
2104518
|
1945845
|
1511758
|
994943
|
819674
|
|
China-ASEAN total import and export volume(ten-thousand dollars)
|
48028614
|
44359813
|
40014620
|
36308871
|
29286053
|
21300583
|
23131970
|
20253262
|
16083773
|
13036139
|
Asean-China Economic Data of Investment
|
Years
|
2014
|
2013
|
2012
|
2011
|
2010
|
2009
|
2008
|
2007
|
2006
|
2005
|
|
The amount of China's actual use of the Philippines direct foreign investment(ten-thousand dollars)
|
9707
|
6726
|
13221
|
11185
|
13806
|
11101
|
12687
|
19532
|
13434
|
18890
|
|
The amount of China's actual use of the Cambodia direct foreign investment(ten-thousand dollars)
|
312
|
2251
|
1660
|
1737
|
1035
|
1337
|
292
|
634
|
212
|
276
|
|
The amount of China's actual use of the Laos direct foreign investment(ten-thousand dollars)
|
|
|
200
|
588
|
945
|
243
|
670
|
300
|
|
|
|
The amount of China's actual use of the Malaysia direct foreign investment(ten-thousand dollars)
|
15749
|
28053
|
31751
|
35828
|
29433
|
42874
|
24696
|
39725
|
39348
|
36139
|
|
The amount of China's actual use of the Myanmar direct foreign investment(ten-thousand dollars)
|
585
|
585
|
384
|
1021
|
352
|
339
|
330
|
326
|
736
|
374
|
|
The amount of China's actual use of the Thailand direct foreign investment(ten-thousand dollars)
|
6052
|
48305
|
7772
|
10120
|
5134
|
4866
|
12921
|
8948
|
14482
|
9590
|
|
The amount of China's actual use of the Brunei direct foreign investment(ten-thousand dollars)
|
7094
|
13319
|
15109
|
25582
|
30956
|
34812
|
34042
|
37688
|
29421
|
16039
|
|
The amount of China's actual use of the Singapore direct foreign investment(ten-thousand dollars)
|
582668
|
722872
|
630508
|
609681
|
542820
|
360484
|
443529
|
318457
|
226046
|
220432
|
|
The amount of China's actual use of the Indonesia direct foreign investment(ten-thousand dollars)
|
7802
|
12623
|
6378
|
4607
|
7684
|
11172
|
16725
|
13441
|
10068
|
8676
|
|
The amount of China's actual use of the Vietnam direct foreign investment(ten-thousand dollars)
|
7
|
|
316
|
129
|
203
|
592
|
207
|
73
|
1366
|
127
|
|
The amount of China's actual use of the ASEAN direct foreign investment(ten-thousand dollars)
|
629976
|
834734
|
707299
|
700478
|
632368
|
467820
|
546099
|
439124
|
335113
|
310543
|
Data Source: National Bureau of Statistics of China
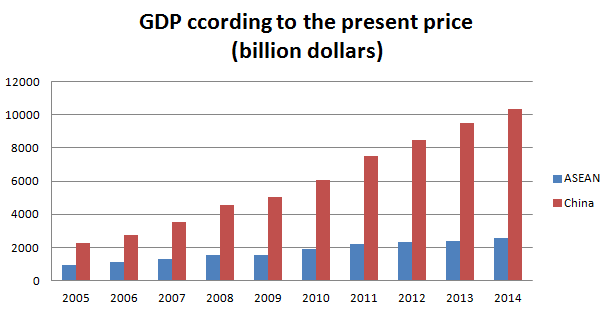
Gross Domestic Product (GDP)
|
GDP ccording to the present price (a billion dollars)
|
2005
|
2006
|
2007
|
2008
|
2009
|
2010
|
2011
|
2012
|
2013
|
2014
|
|
ASEAN
|
923
|
1,107
|
1,326
|
1,538
|
1,538
|
1,898
|
2,206
|
2,337
|
2,402
|
2,571
|
|
China
|
2,269
|
2,730
|
3,523
|
4,558
|
5,059
|
6,040
|
7,492
|
8,462
|
9,491
|
10,360
|
Real GDP Growth Rate
|
Real GDP growth in local currency (weighted)
|
2005
|
2006
|
2007
|
2008
|
2009
|
2010
|
2011
|
2012
|
2013
|
2014
|
|
ASEAN
|
5.9
|
6.1
|
6.6
|
4.9
|
2.2
|
7.6
|
5.1
|
6
|
5.2
|
4.6
|
|
China
|
11.4
|
12.7
|
14.2
|
9.6
|
9.2
|
10.6
|
9.5
|
7.8
|
7.7
|
7.4
|
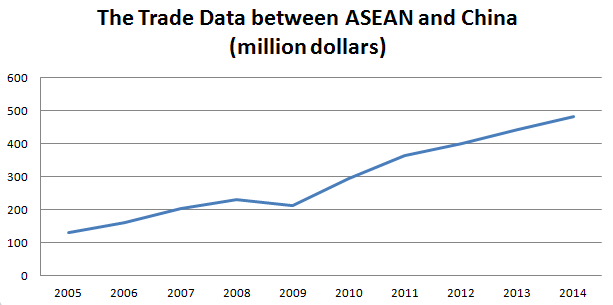
The Trade Data between ASEAN and China (million dollars)
|
The Trade Data between ASEAN and China (million dollars)
|
|
Years
|
2005
|
2006
|
2007
|
2008
|
2009
|
2010
|
2011
|
2012
|
2013
|
2014
|
|
Total
|
130.4
|
160.6
|
202.5
|
231.1
|
213.0
|
292.8
|
362.8
|
400.1
|
443.6
|
480.4
|
China's Direct Investment to ASEAN (million dollars)
|
China's Direct Investment to ASEAN (million dollars)
|
|
Years
|
2005
|
2006
|
2007
|
2008
|
2009
|
2010
|
2011
|
2012
|
2013
|
2014
|
|
Total
|
151
|
1,957.70
|
2,129.60
|
946.8
|
1,965.50
|
4,052.30
|
7,860.20
|
5,718.10
|
6,778.50
|

Governments:
Commerce Departments:
Customs:
Quality Inspection Department:
|

